ENDscript  2.0


News
October 1st, 2024: we are pleased to announce the release of our new webservice: FoldScript


Expand    Go to What is ENDscript?
    Go to Main key points
    Go to ENDscript is easy
    Go to How does it work?
    Go to Examples of outputs
    Go to ENDscript is open
    Go to Terms of use
What is ENDscript?
ENDscript is a user-friendly web server that extracts and renders a comprehensive analysis of primary to quaternary protein structure information in an automated way.

  • ENDscript is a tool of choice for biologists and structural biologists, allowing them to generate a set of detailed, high-quality figures and interactive 3D representations of their proteins of interest with just a few mouse clicks.
    This allows the experimenter to quickly explore the structure of their favorite protein and identify areas of conservation.
  • All ENDscript needs is the 3D coordinates of the liganded or unliganded protein of interest in PDB or CIF format.
  • With its simple interface and its ability to quickly render the key features of any protein, ENDscript is also an effective educational tool that can be used during courses or practical work sessions in structural biology.
ENDscript 3D representation
ENDscript 2D figure


ENDscript key points
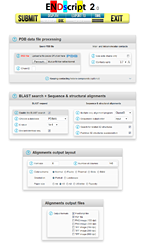
From a typed PDB identifier or an uploaded PDB/CIF file, ENDscript quickly generates the following downloadable illustrations:

  1. A first flat figure presenting:

    • The amino acid sequence of the query structure adorned with secondary structure elements,
    • Solvent accessibility and hydropathy scales per residue.
    • And, if applicable:
    • Non-crystallographic and crystallographic protein:ligand and protein:protein contacts,
    • Disulfide bridges.
  2. A second flat figure showing in addition to the previous information:

    • A multiple sequence alignment of homologous proteins colored according to residue conservation,
    • The secondary structure elements of each homologous sequence of known structure.
  3. Two interactive 3D representations of the query structure:

    • A ribbon representation of the protein colored according to sequence conservation.
    • A variable tube representation of the protein backbone, whose radius is proportional to the differences in Cα position between the query and all homologous proteins of known structure.
    • In addition, these two 3D representations of the query may include, if applicable:
    • Biological assembly,
    • Multiple NMR models,
    • Selected ligands with contacting residues,
    • Identical residues according to the multiple sequence alignment.
Finally, the user can download a zip file containing structures of homologous proteins, all superimposed to the query.

ENDscript phase 3
ENDscript phases 1 and 2


ENDscript is easy!
We have put a lot of effort into making ENDscript fast and easy to use:

  • No special knowledge of bioinformatics is required to obtain comprehensive and relevant illustrations.
  • The user is guided through the process by tooltips and detailed help topics that are accessible at any time.
  • Thanks to its automated pipeline and a parallel programming, ENDscript can deliver results in one click and within a minute.
  • Advanced or expert users can change settings to fine-tune ENDscript at their needs.
  • ENDscript produces publication-quality illustrations in most common file formats (PDF, PostScript, PNG and TIFF) and sizes (US Letter, A4, A3, A0 and the gigantic 'Tapestry' format).
  • ENDscript is accessible from any Web browser equipped with a PDF reader. To take advantage of the interactive 3D representations, PyMOL (free open-source or commercial version) is required.
ENDscript GUI


How does ENDscript work?
ENDscript taked as a query either a four-digit PDB identifier (e.g. 2CAH) or an uploaded coordinate file in PDB or CIF format (NMR and crystallographic structures are supported).

ENDscript's automated pipeline involves several sequence and structure analysis software and is divided into three sequential phases:

  1. Phase 1:

    • The query structure is processed with SPDB, a homemade program, and the amino acid sequence is extracted.
    • A second SPDB output is generated and passed to DSSP to extract secondary structure elements, disulfide bridges and solvent accessibility per residue.
      This second SPDB file is also used by CNS to determine non-crystallographic and crystallographic protein:ligand and protein:protein contacts.
    • At this point, ENDscript renders a first figure via our ESPript program:
      • Secondary structure elements and residues in alternate confirmation are shown on the top of the sequence query.
      • Accessibility and hydropathy scales, intermolecular contacts and possible disulfide bridges are shown at the bottom.

  2. Phase 2:

    • A BLAST+ search using the sequence of the query structure is performed against a chosen sequence database (PDBAA by default) to detect protein homologues.
    • The result is piped to a chosen multiple sequence alignment software (Clustal Omega, MAFFT, MSAProbs or MultAlin).
    • A second figure is then generated by ESPript:
      • It shows the aligned sequences colored according to their degree of similarity.
      • In addition, each homologous sequence of known 3D structure is adorned with its secondary structure elements extracted by DSSP.
      • Further information is presented on the bottom alignment as in phase 1.

  3. Phase 3:

    • Two PyMOL session files are generated. They can be downloaded and interactively examined with the molecular 3D visualization program PyMOL installed on the user's computer.
    • The first PyMOL file is called "Cartoon":
      This is a ribbon depiction of the query structure colored as a function of the similarity scores calculated from the previous multiple sequence alignment.
      This color ramp from white (low score) to red (identity) allows to quickly locate areas of weak and strong sequence conservation on the query structure.
      A solvent-accessible surface can be mapped with the same coloring code using the PyMOL control panel.
    • The second PyMOL file is called "Sausage":
      It shows a variable tube representation of the Cα trace of the query.
      For this drawing, all homologous protein structures have been superimposed on the PDB/CIF query using ProFit, and the size of the tube is proportional to the mean per-residue r.m.s. deviation between Cα pairs.
      The same white-to-red color ramp is used to visualize possible substitutions in sequence.
      This allows the user to identify areas of weak and strong structural conservation and correlate this result with sequence conservation.
    • If applicable, these two PyMOL representations can display an assortment of supplementary information compiled by ENDscript:
    • Biological assembly (Cα trace style),
    • Multiple NMR models (pink Cα trace),
    • Disulfide bridges,
    • Nucleic acids / ligands / monatomic elements and their contacting residues (ball&stick style),
    • Water molecules,
    • Strictly conserved residues (magenta ball&stick),
    • PDB SITES markers (blue mesh).
    • All these features are fully editable by the user thanks to the PyMOL control panel and publication-quality pictures can be rendered quickly.
  • For more details on the automated pipeline and user-accessible settings, please refer to the User Guide.

ENDscript can handle up to 3,000 distinct sequences adorned with their secondary structure elements and render their representation in the gigantic 'Tapestry' format (0.8 × 3.3 meters)!


ENDscript tapestry
ENDscript 3D representation


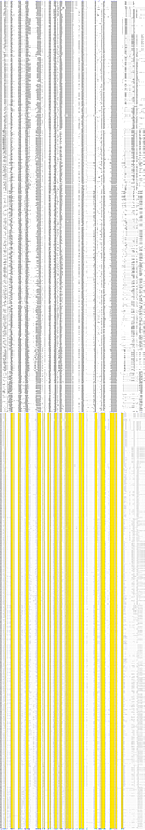
Examples of ENDscript outputs
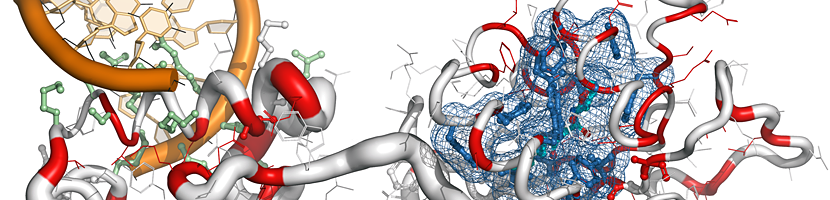
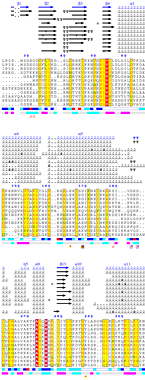
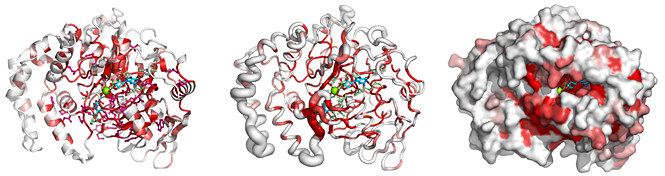
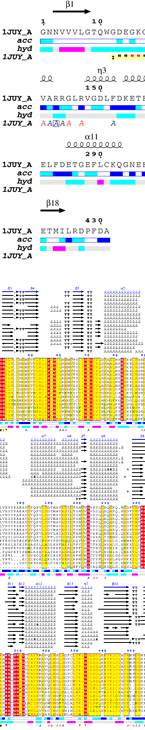
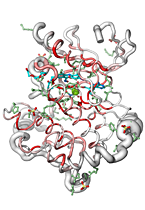
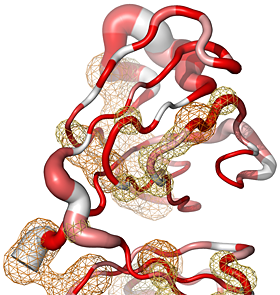
Here are some excerpts from ENDscript-generated flat figures and PyMOL sessions (PDB entry 3OYA).
(Click on the thumbnails to access full-size pictures)
ENDscript flat figure (phase 1)
ENDscript phase 1
Query only
ENDscript flat figure (phase 2)
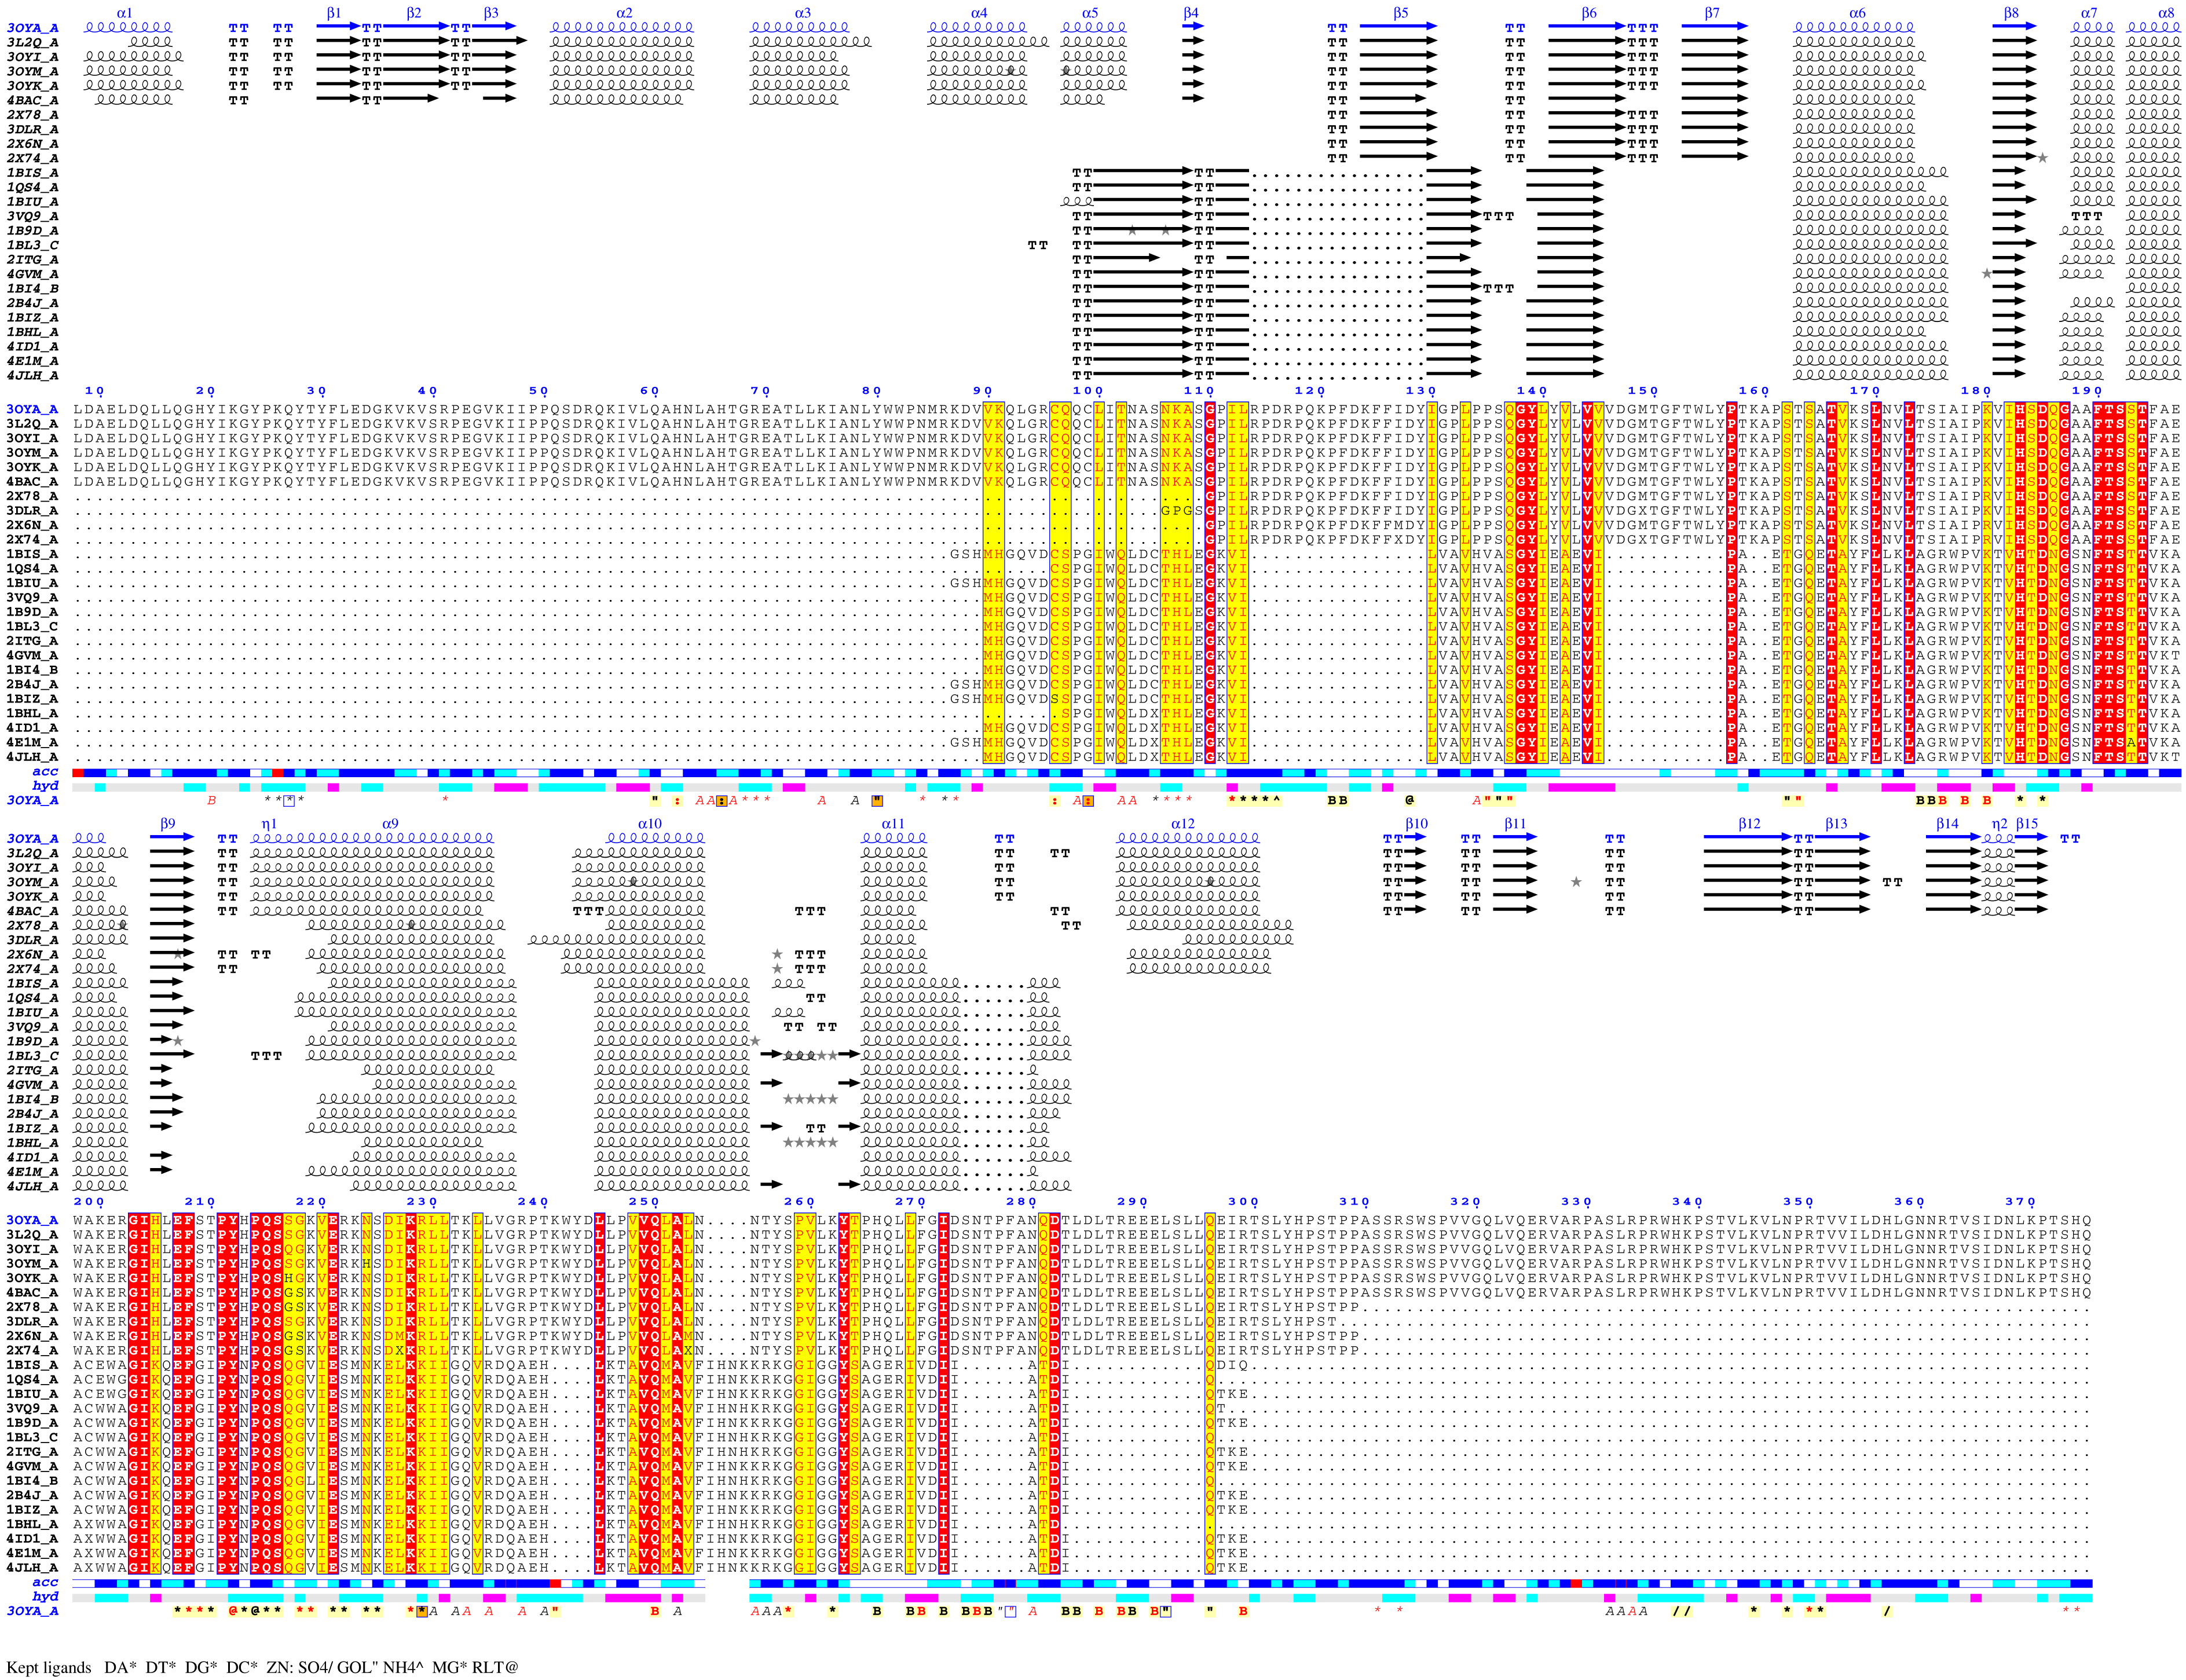
ENDscript phase 2
Query and
homologous
PyMOL Cartoon representation
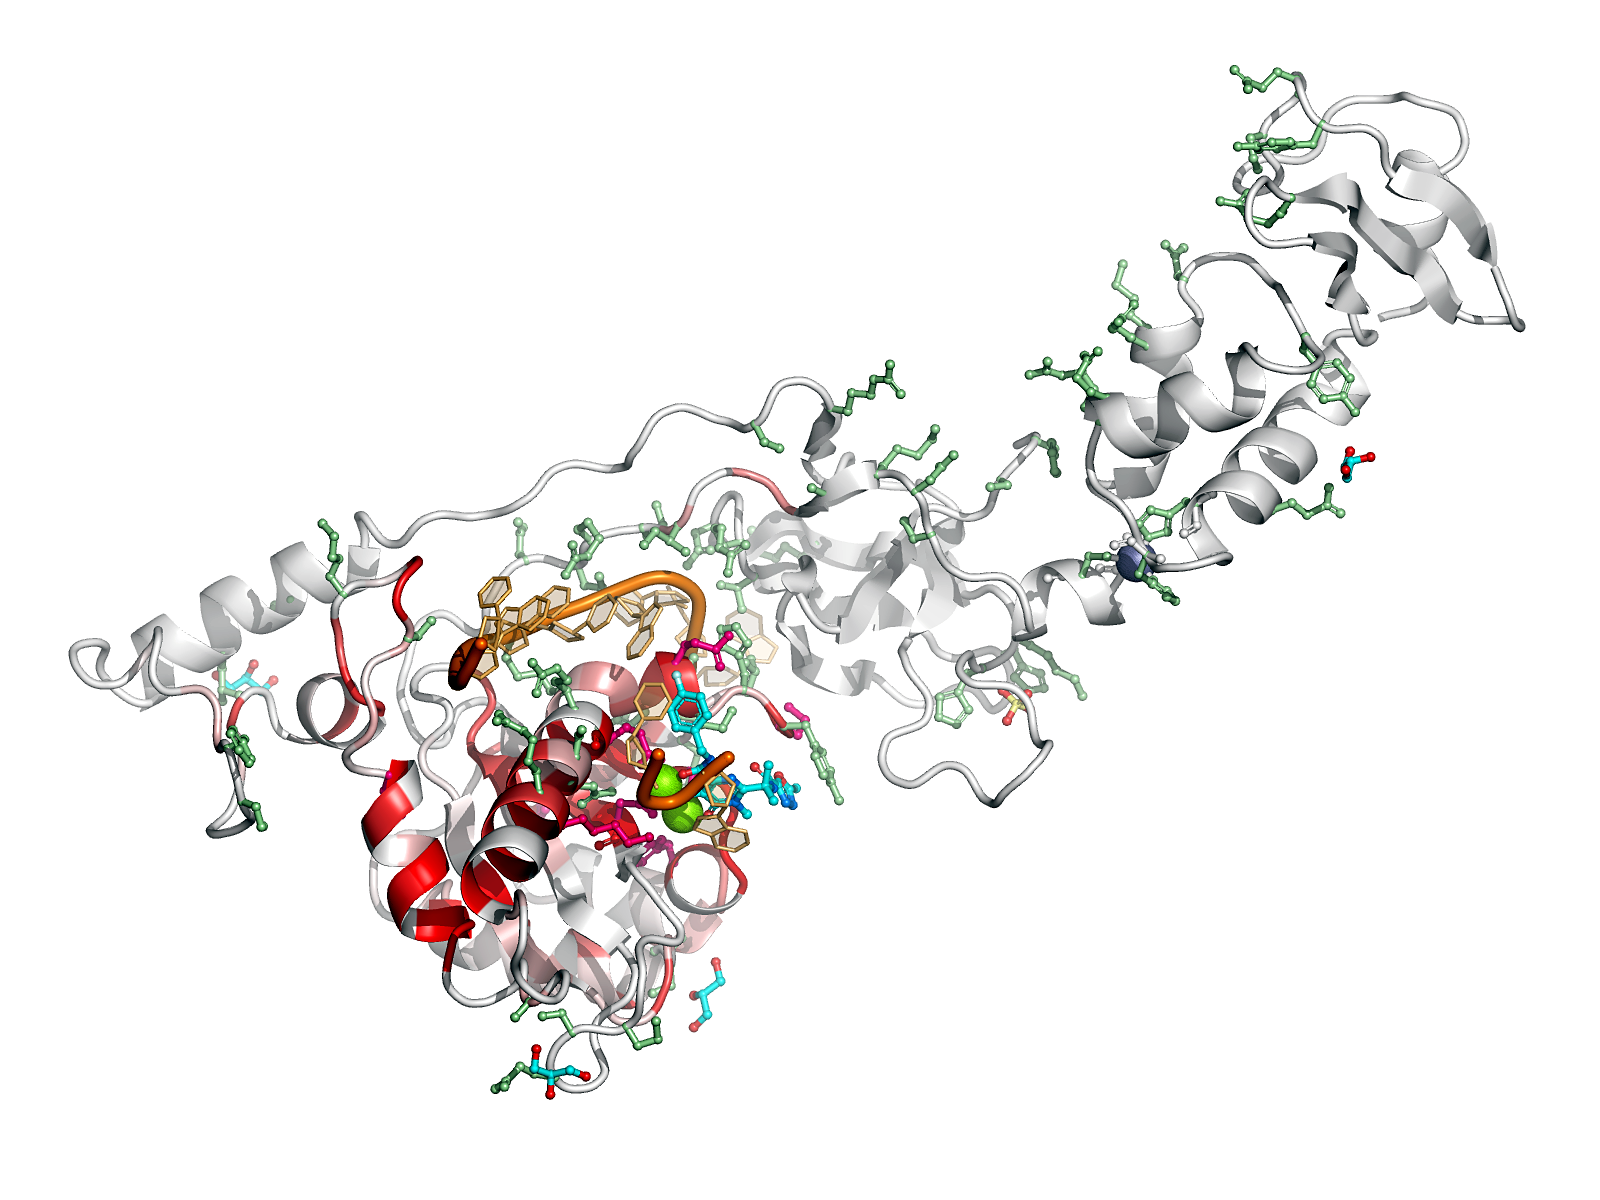
ENDscript phase 3
PyMOL Cartoon
representation
PyMOL Sausage representation
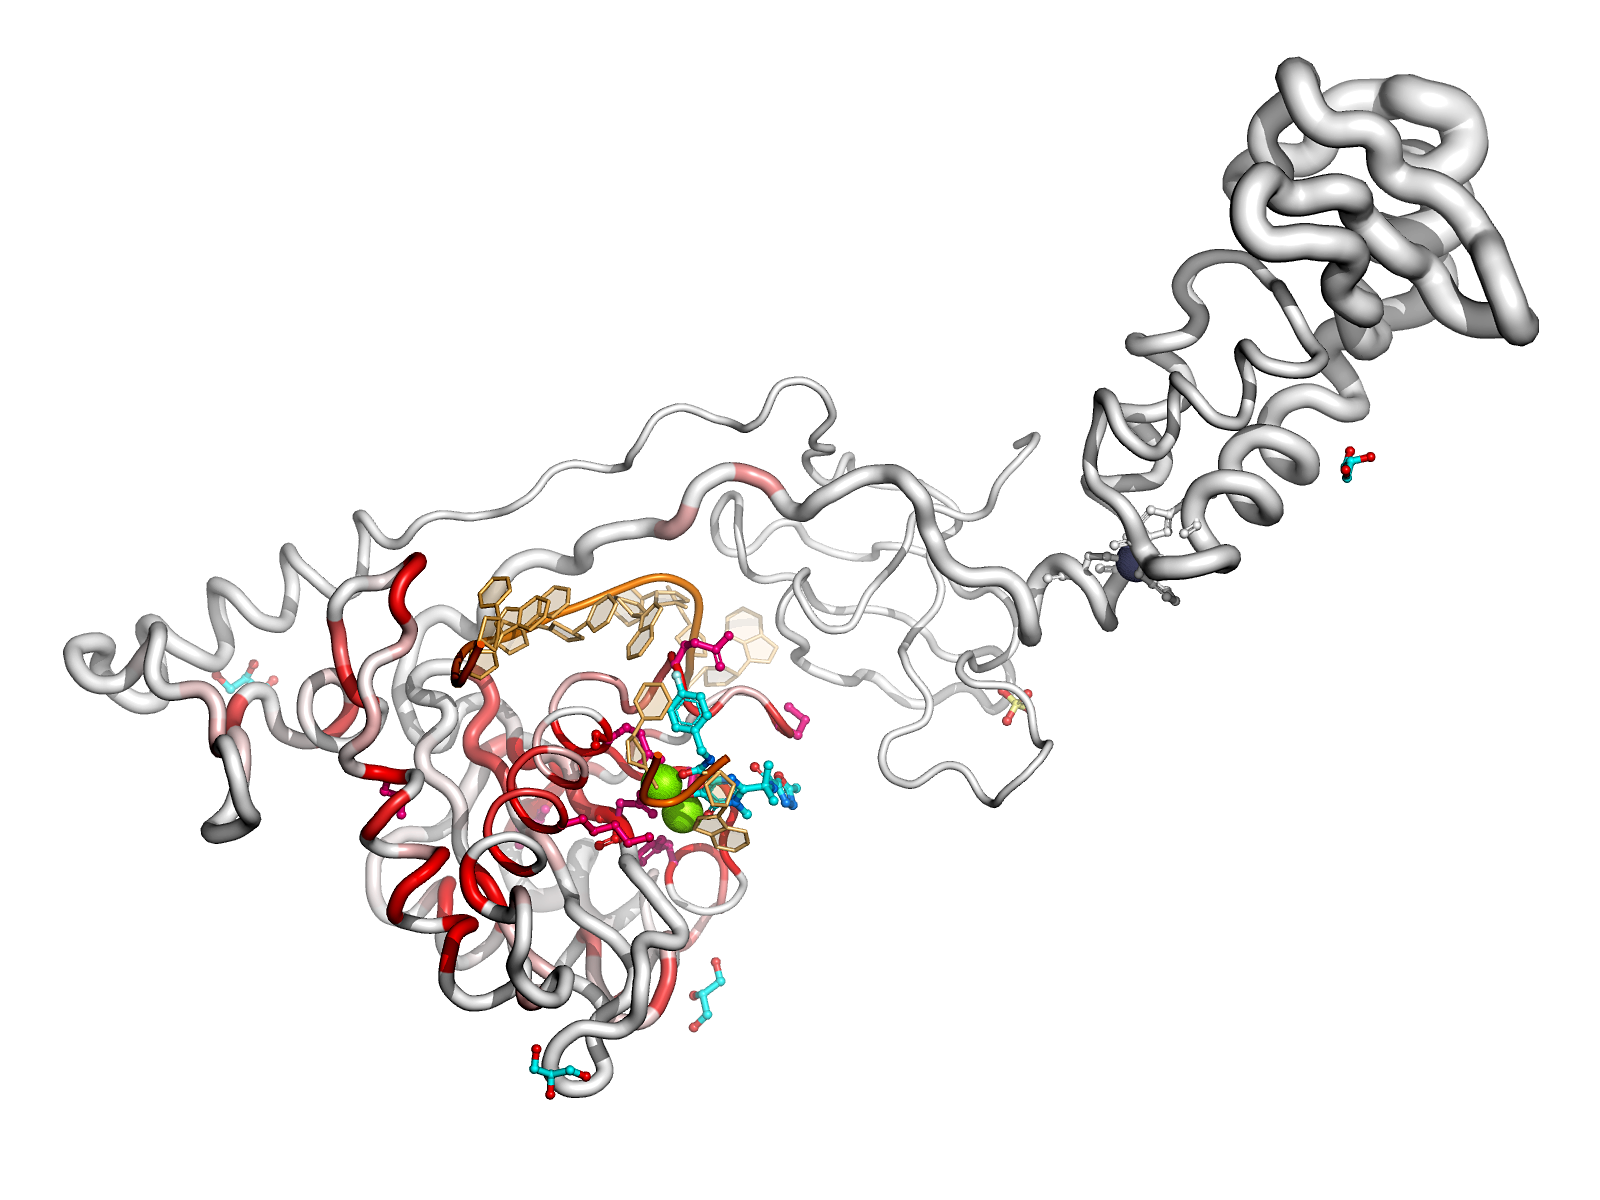
ENDscript phase 3
PyMOL Sausage
representation
PyMOL Surface representation
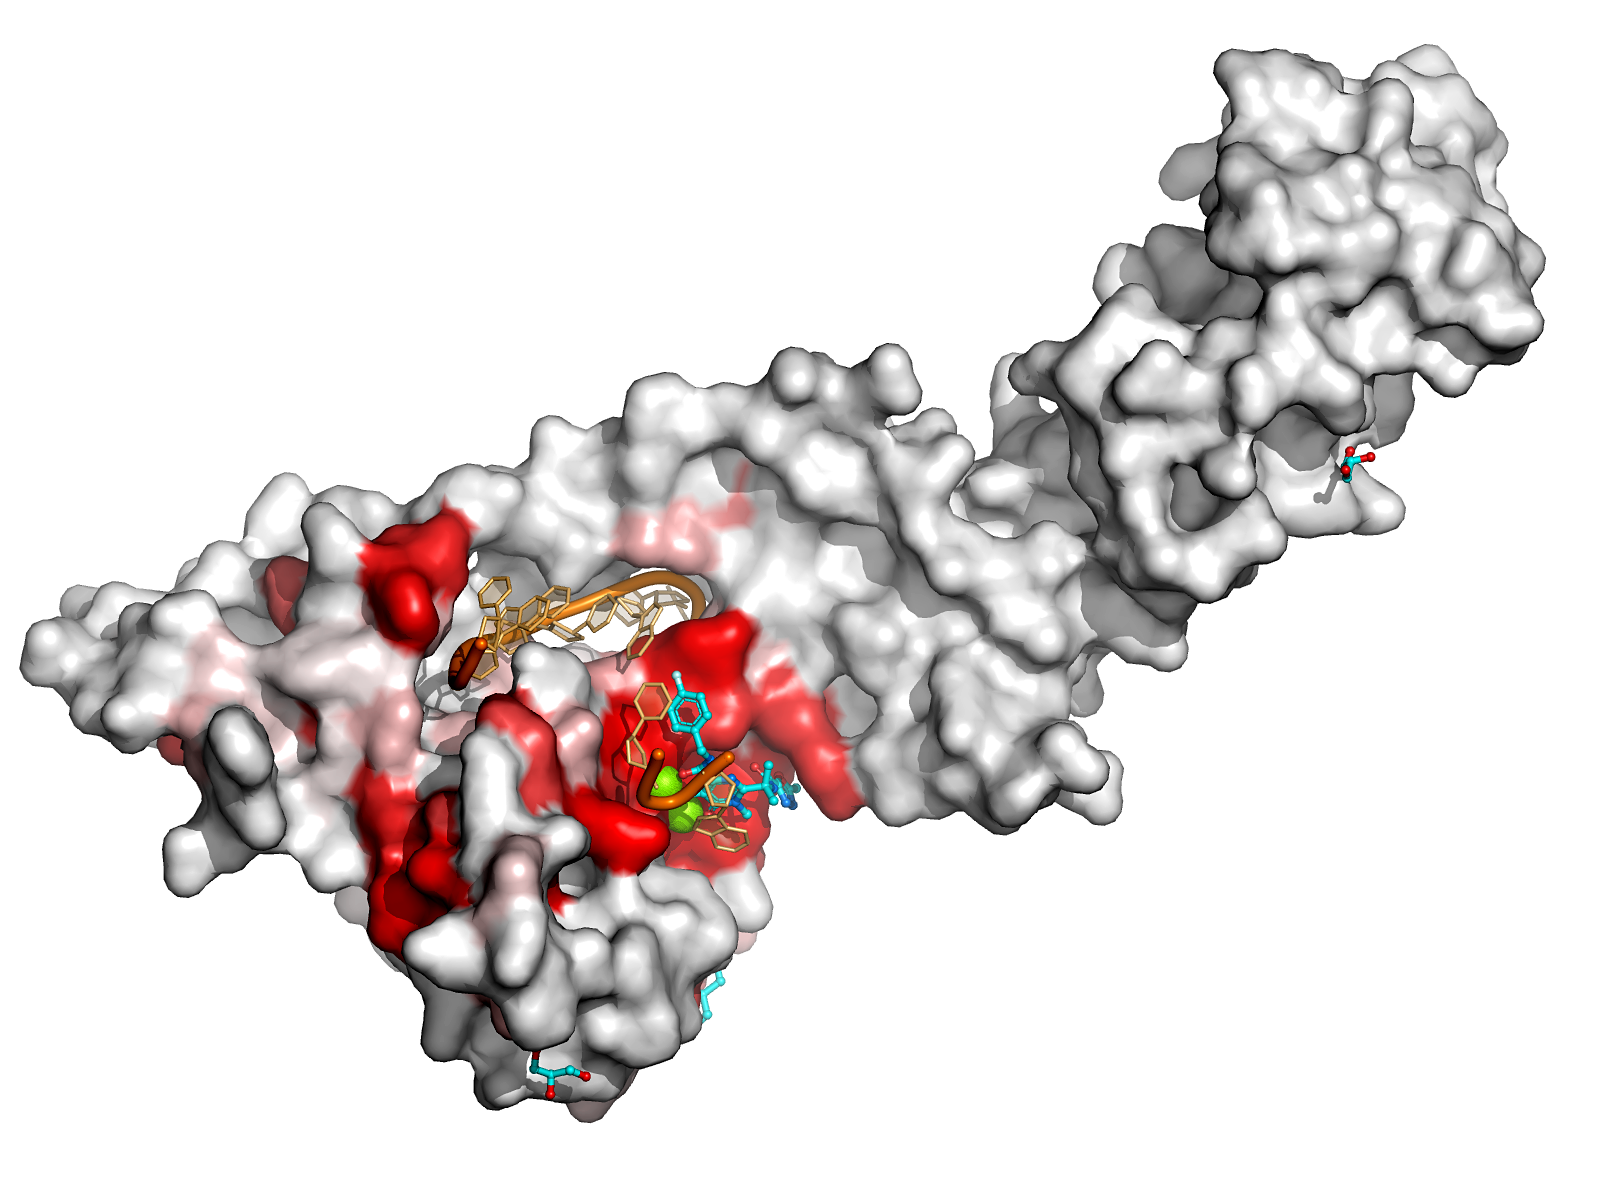
ENDscript phase 3
PyMOL Surface
representation
PyMOL screen capture
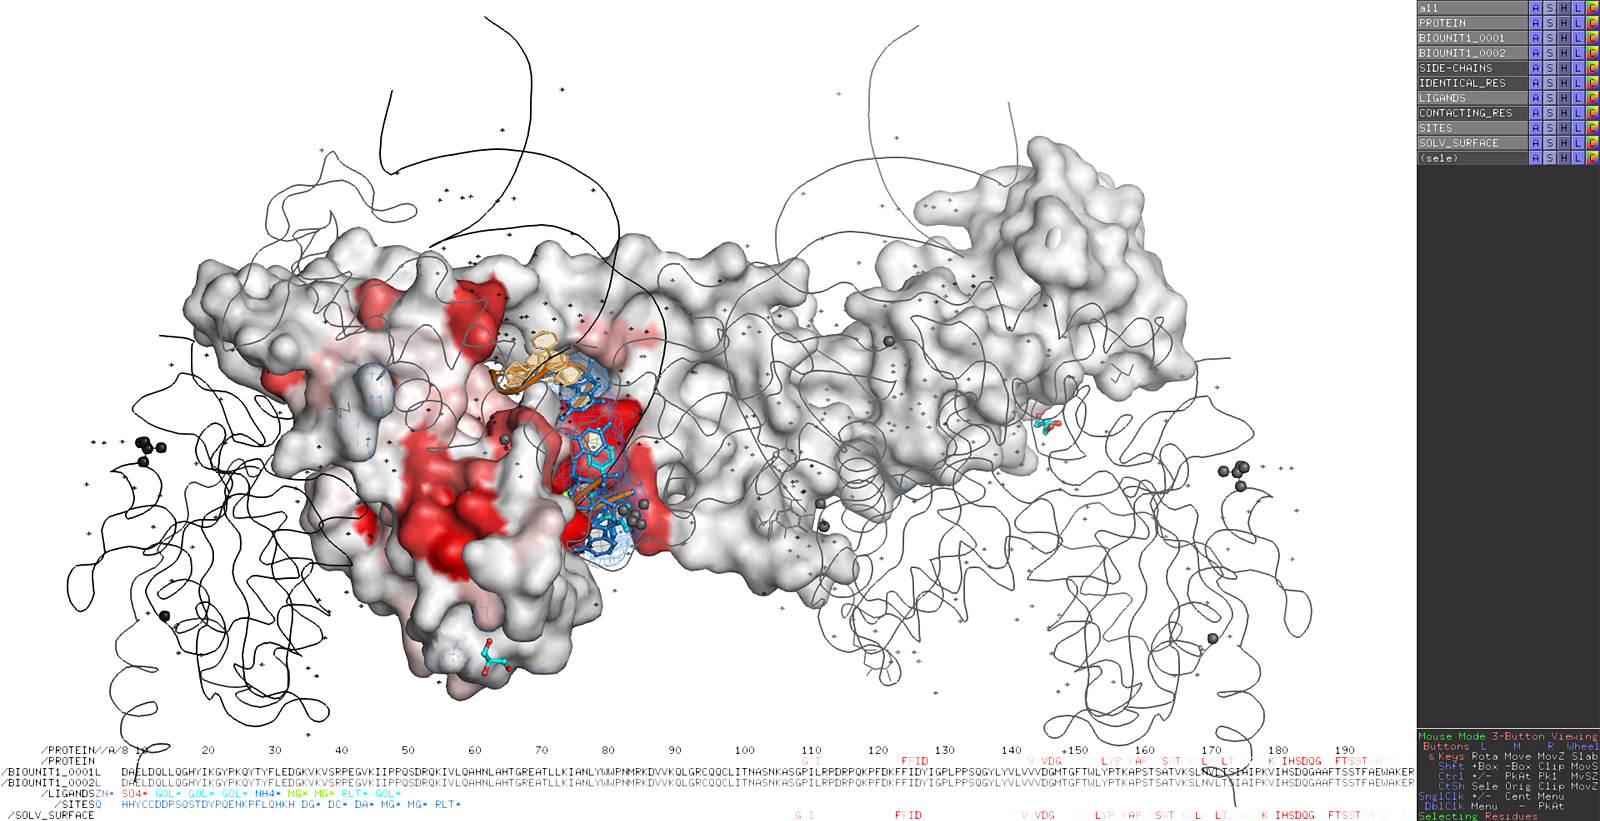
ENDscript phase 3
PyMOL screen
capture


ENDscript is open to external bioinformatics services
We have designed ENDscript 2 as an open platform for the visualization of multiple biochemical and structural information:

  • ENDscript also has the ability to display a wide range of supplementary data from external sources for its primary to quaternary structure representations.
  • Thus, if you are the author of a biotool Web server that calculates or predicts structure-related properties, you can use ENDscript for effective display. This requires that your server provides ENDscript with a modified PDB file that conforms to some simple annotation conventions.
  • Specifically, this supplementary information can be represented by colored bars or special characters in the ENDscript sequence alignment figure. It can also be displayed in 3D with PyMOL by highlighting the corresponding areas with a specific coloring scheme and/or by any other means (spheres, dots, meshes, surfaces, etc.)

  • If you are interested in interfacing your service with ENDscript, please contact us at espript@ibcp.fr.
ENDscript 2D figure


Terms of use
  • ENDscript 2 is developed and maintained by Patrice GOUET and Xavier ROBERT in the "Retroviruses and Structural Biochemistry" research team of the "Molecular Microbiology and Structural Biochemistry" laboratory (UMR5086 CNRS / University Lyon 1). ENDscript 2 is a major upgrade of ENDscript 1.x, which was created by Patrice GOUET and Emmanuel COURCELLE.
  • ENDscript is provided as a service to the scientific community and can be used free of charge for research and educational purposes without restriction.
  • When publishing data resulting from the use of ENDscript, please use the following citation:
    • Robert, X. and Gouet, P. (2014) "Deciphering key features in protein structures with the new ENDscript server". Nucl. Acids Res. 42(W1), W320-W324 - doi: 10.1093/nar/gku316 (freely accessible online).
  • Do not hesitate to contact us (espript@ibcp.fr) if you need any further information or if you need some help with ENDscript.
  • The authors make no warranties regarding the correctness of the data. Their responsibility is limited to applying best efforts in providing the most reliable and accurate service. The authors are not responsible for the use of the results, data or information obtained from this server. This Web server is hosted on the CNRS network and governed by French law. By accessing this website or using all or part of its functions, users formally accept the application of French law. This website does not use tracking cookies or cookies that collect personal data for marketing or analytical purposes (see our 'Cookie Policy'). This website uses an encrypted connection (HTTPS). The IP address of the client computer and the date and time of the connection are processed for usage statistics. No other data is collected and no data is transferred to third party partners or sites.


SBGrid © 2005-2025 The ENDscript authors & CNRS - Contact: espript@ibcp.fr
ESPript is an SBGrid supported application


Share ENDscript in  Facebook Twitter Reddit Email